Turn Savings into Business Innovations
Business leaders must constantly manage the top line and the bottom line simultaneously. But would they generate enough revenue to achieve their ambitious goals without innovation or digital transformation? In our digital era, growing a business without a digital presence is becoming less and less probable. Digital presence also means constant change. Technologies and platform three-years old are already outdated. Therefore business leaders need money to innovate.
Henning Kagermann, the former CEO of SAP I worked with during many critical customer situations, used a very simple strategy to stay on top: he funded SAP’s innovation strategy by IT cost savings (Fig. 1). Ok, the cloud era wasn’t in sight at the time, but his mantra was applied to customer situations as well. Fast forward to today, company chiefs must manage their business with stagnant or even shrinking budgets and be capable of driving innovation for their business leaders. Many – if not all – move their core IT applications to the cloud. This move should save them already some money.
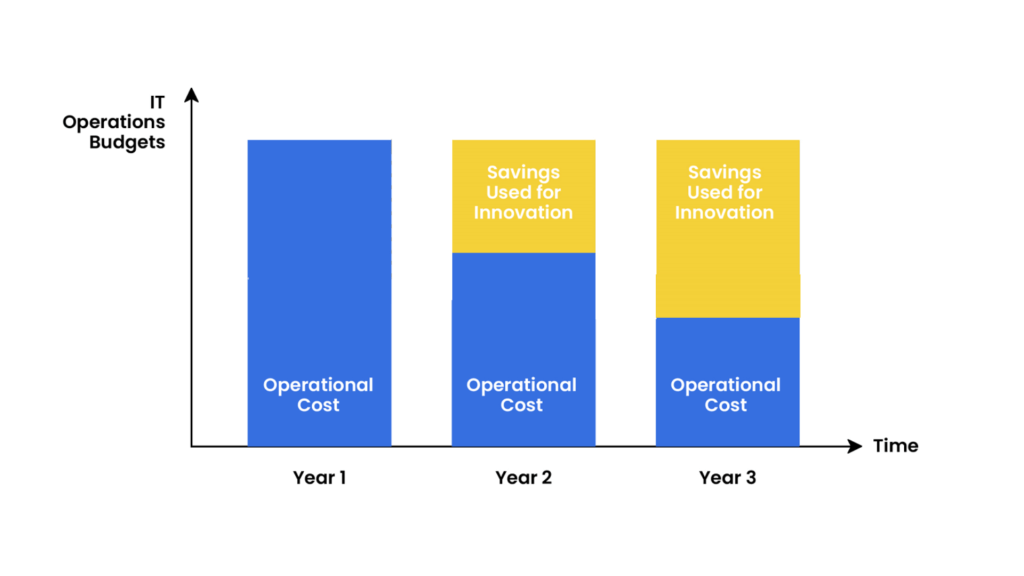
Fig.3 Save Operational Cost and Use it for Innovations
But when they move to the cloud, do they still need an ERP system? Of course they do. And by moving to the cloud and renovating or innovating the entire business process architecture, the leaders need to know where the journey should end. They need an ERP Roadmap.
How To Develop Your ERP Roadmap?
Analyze your As-Is technical architecture
Your As-Is Architecture (i.e., your current architecture) represents how systems, applications, data, and infrastructure are collaborating and interconnected – it encompasses all hardware, software, networks, and databases.
The analysis of the as-is technical architecture serves as the starting point for assessing strengths, weaknesses, opportunities, and threats. We at ERP Strategies LLC strongly focus on identifying pain points, bottlenecks, and inefficiencies. These insights drive decisions for future enhancements or system migrations.
The deliverable includes architectural diagrams, system inventories with sizing information, and descriptions of the systems’ main purpose. The visualizations help stakeholders to better understand the existing IT landscape while facilitating communication among technical teams (see Fig. 2).
The as-is technical architecture is the prerequisite for any technical roadmap planning.

Fig. 2 Example of an As-Is Technical Architecture.
Analyzing the As-is Business Process Architecture
The second cornerstone of an ERP roadmap is the analysis of the as-is business processes. Understanding business context and focus is crucial during any transformational stage. The outcome of this analysis is a detailed process description showing the current state of the company’s business processes up to an L3 process level. It also covers company culture and other capabilities that are relevant for the Organizational Change Management (OCM). The analysis also outlines how data and information flows through the business units.
This as-is analysis aims to provide two deliverables. Firstly, a mapping of business processes onto (cloud) applications. And secondly, a baseline for identifying areas for improvement, optimizing the use of resources, and ultimately increasing efficiency and productivity.
You and us at ERP Strategies LLC can develop the required strategy to eliminate bottlenecks, reduce manual work, and digitize all business processes. This work result serves as the foundation to save money for innovation.

Fig.3 shows the Level 1 and Level 2 Business Process description of a corporation
Identifying Pain Points of Business Units
Mapping the business processes onto the technical architecture allows us to identify quickly the ‘low-hanging fruits’ to improve business processes. Typically, we’re using Swim Lane Diagrams to visualize processes and process steps. A “Swim Lane Diagram” is a flowchart that visualizes who does what within a given software application.
The Swim Lane Diagram shows connections, communication, and handoffs between different roles. Its visualization reveals responsibilities, manual work steps, inefficiencies, and bottlenecks in a process (see Fig.4 as an example).
While pain points are being captured during this analysis step (see the orange dots on Fig.4), many of these finding can be addressed right away with conceptual solution proposals.
The deliverable of this analysis includes action plans with ownerships and next steps.

Fig.4: Swimlane diagram of the “Deliver” business process
The ERP Roadmap
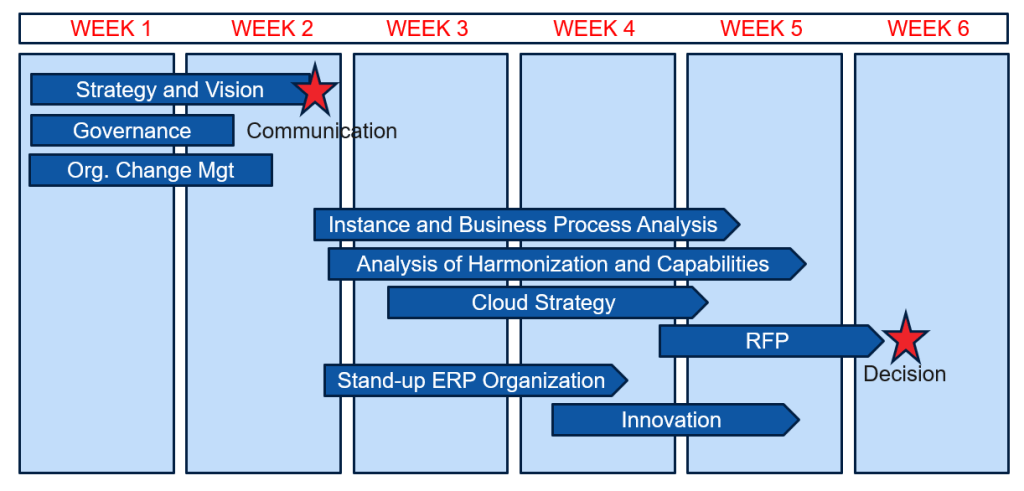
After the foundational as-is analysis, the vision for a new ERP platform materializes by compiling the findings with the company’s to-be vision for the new platform. Fig.5 shows the two main stages:
- Preparation stage with establishing the vision, governance and Organizational Change Management (OCM)
- Creation stage of the roadmap with instance and business process analysis, process harmonization, cloud strategy, ERP organization, innovation and the Request for Proposals (RFP) in case external System Integrators are being used.
The ERP Roadmap visualizes the two roadmap stages including its different phases and building blocks that are required to migrate and/or upgrade an older ERP system or to implement a new application within the cloud.

Leave a comment