

Six Sigma is a data-driven methodology designed to improve processes, reduce defects, and enhance overall quality by minimizing variability. The methodology originated in manufacturing but is applicable across many high-volume industries. Six Sigma aims to achieve near-perfect performance with a defect rate of 3.4 defects per million opportunities. It systematically identifies and eliminates the root causes of problems to create efficient, high-quality processes.
The Six Sigma methodology uses a structured DMAIC framework:
- Define: Identify the problem, project goals, and customer requirements.
- Measure: Gather data to understand current process performance and establish baselines.
- Analyze: Use statistical tools to determine the root causes of issues.
- Improve: Develop, test, and implement solutions for root causes.
- Control: Maintain improvements with controls, monitoring, and training.
Six Sigma emphasizes customer-centricity, striving for measurable financial and operational benefits. It uses sophisticated statistical calculations, such as statistical control charts (SPC), Pareto charts, etc.
Trained and certified practitioners lead and support improvement projects. Typical certification levels include Yellow Belts, Green Belts, Black Belts, and Master Black Belts. The following provides a summary of a fictitious Six Sigma report accepted by the Council For Six Sigma Certifications (C.S.S.C.). The author received a Green Belt Level II Certification and published the full report on Reserachgate.net.
Six Sigma Green Belt Level II Case Study
Company Overview of Global Plasma Inc
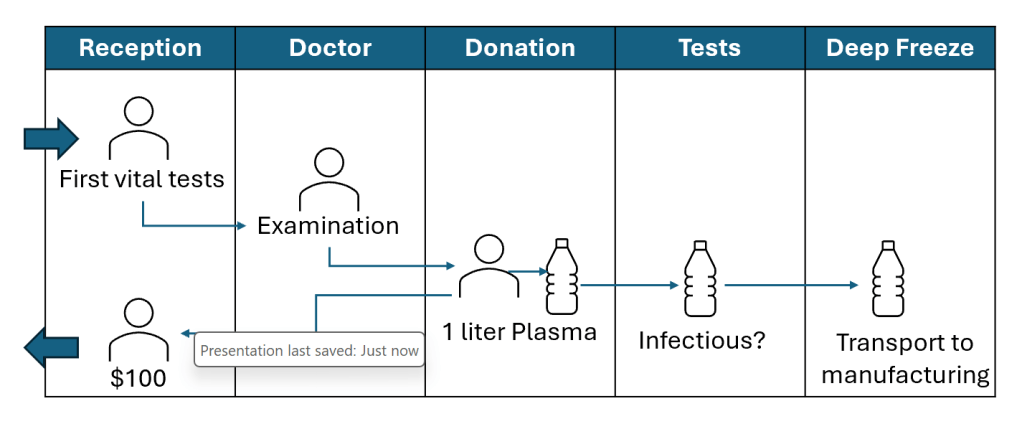
Global Plasma Inc. collects human plasma to produce life-saving therapies. Operating more than 300 plasma collection centers globally, the company faces challenges in plasma center throughput, donor retention, and achieving growth targets.
Project Scope and Objectives
A Six Sigma DMAIC (Define, Measure, Analyze, Improve, Control) project at a nearby Plasma Center aimed to
- Enhance donor experience by reducing total cycle time (target: 100 minutes).
- Increase plasma center bed occupancy and throughput.
- Achieve a 15% growth in plasma collection to meet revenue goals.
DEFINE Phase:
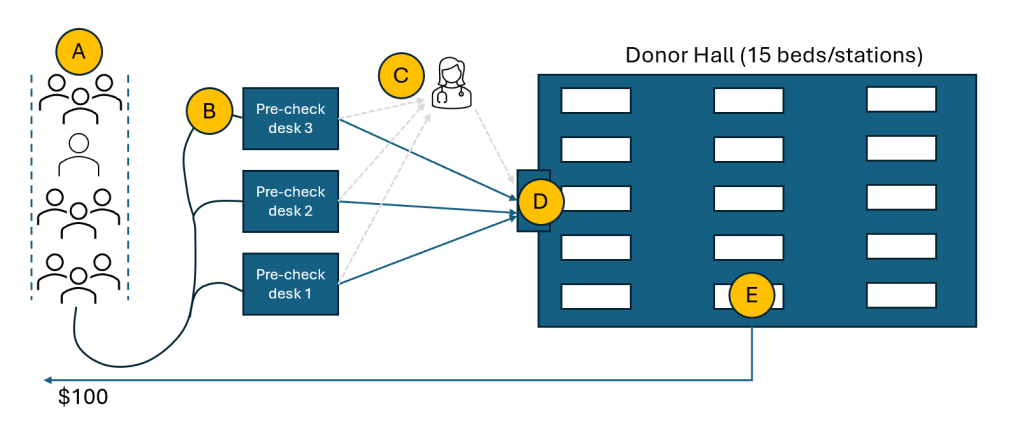
Key issues identified included low bed occupancy, lengthy donor wait times, and donor dissatisfaction. Critical-to-quality (CTQ) metrics were identified as donor wait times at check-in, evaluations, and donation stages.
MEASURE Phase:
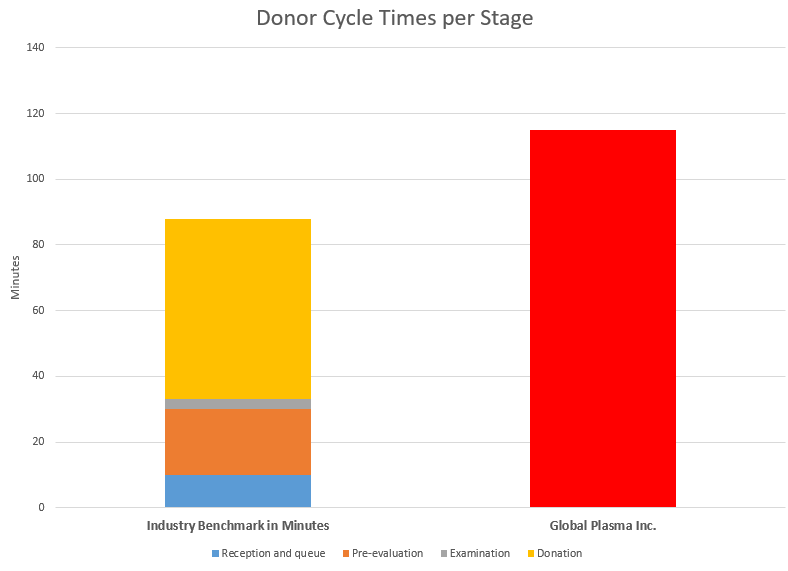
Data collected showed an average Donor Cycle Time (DCT) of 115 minutes, exceeding the industry benchmark of 88 minutes. Key delay points included pre-check, donor evaluation, and bed preparation times.
ANALYZE Phase:
Root causes identified:
- Understaffed pre-check desks.
- Late donor arrivals.
- Repeat blood tests due to errors.
- Plasma machines malfunctioning.
- Delayed bed preparations.
Statistical and root cause analysis confirmed inefficiencies.
IMPROVE Phase:
Solutions were developed and piloted, focusing on:
- Optimizing staff shifts.
- Improving machine maintenance.
- Enhancing scheduling and training processes.
Solutions were scaled and documented for consistent implementation.
CONTROL Phase
Control measures, including dashboards and control charts, were implemented to monitor and sustain improvements. A robust handover process ensured operational management adopted the improved practices.
Results and outlook
Efficiency improvements reduced cycle times, increased throughput by 15%, and set the stage for potential rollout across all centers, promising significant financial growth ($1 billion in potential revenue improvement globally).

Leave a comment